


Stay in the know
Receive timely insights and briefings from HSF Kramer, tailored to keep you informed and ahead
Subscribe now
The Australian secondary equity capital markets proved to be strong in 2025, with 285 transactions raising approximately $24 billion, up from 225 transactions raising $20.6 billion in 2024.
This article builds on our review of secondary raising activity in 2024 (2024 Review) and analyses key trends observed in 2025, including offer structures, transaction sizes, pricing discounts, use of proceeds, underwriting arrangements and sector participation. We also compare secondary raising activity in 2025 with that seen in 2023 and 2024.
Consistent with last year, our analysis focuses on transactions in excess of $10 million, capturing a significant segment of the market. Where relevant, we also consider transactions exceeding $50 million ($50 million Threshold), recognising that trends at the upper end of the market can diverge materially from those evident in smaller raisings.
In addition to the transactions considered in the 2023 and 2024 Reviews, the data analysed for the purposes of this article comprises transactions recorded on Connect4 as at 31 December 2025 as having occurred in 2025. This data was supplemented by a review of relevant market announcements. We have excluded non‑share and non‑CDI secondary raisings, capital notes transactions and strategic placements, as these structures involve features not typical of standard equity capital raisings and would otherwise distort the analysis.
In 2024, for transactions exceeding the $50 million Threshold, standalone placements were the most common offer structure, accounting for 33% of deals. These were followed by combined placement and share purchase plan (SPP) (32%), and combined placement and rights issues (23%).
A similar pattern was observed in 2025, with placements continuing to dominate the Australian ECM landscape for transactions above the $50 million Threshold, representing 45% of deals. Combined placement and SPP transactions again featured prominently (36%), while combined placement and rights issue structures accounted for a smaller proportion of activity (11%).
Of the rights issues analysed, all were structured as accelerated non‑renounceable entitlement offers (ANREOs), with the exception of three renounceable transactions. These comprised a standalone accelerated renounceable entitlement offer (AREO) undertaken by Geopacific Resources Ltd, and combined AREO and placement transactions undertaken by DigitalX Ltd and Ionic Rare Earths Ltd.
In our experience, issuers at the lower end of the market are more likely to require immediate equity funding, often have a smaller retail shareholder base, and are better positioned to rely on enhanced placement capacity under ASX Listing Rule 7.1A. As such, we are not surprised that the smaller deals in 2025 had a greater proportion occurring as placements, and this is consistent with past data. However, we are surprised by the apparent trend across the market toward increasing reliance on placements to the exclusion of other offer structures.
Viewed through a different lens, while placements in larger transactions are more commonly accompanied by a share purchase plan to facilitate retail participation, this feature is notably less prevalent in transactions below the $50 million Threshold.
Offer type (over $50 million threshold in 2025)
.svg)
Offer type (over $50 million threshold in 2024)
%202024.svg)
Offer type (between $10 and $50 million in 2025)
.svg)
Offer type (between $10 and $50 million in 2024)
-2024.svg)
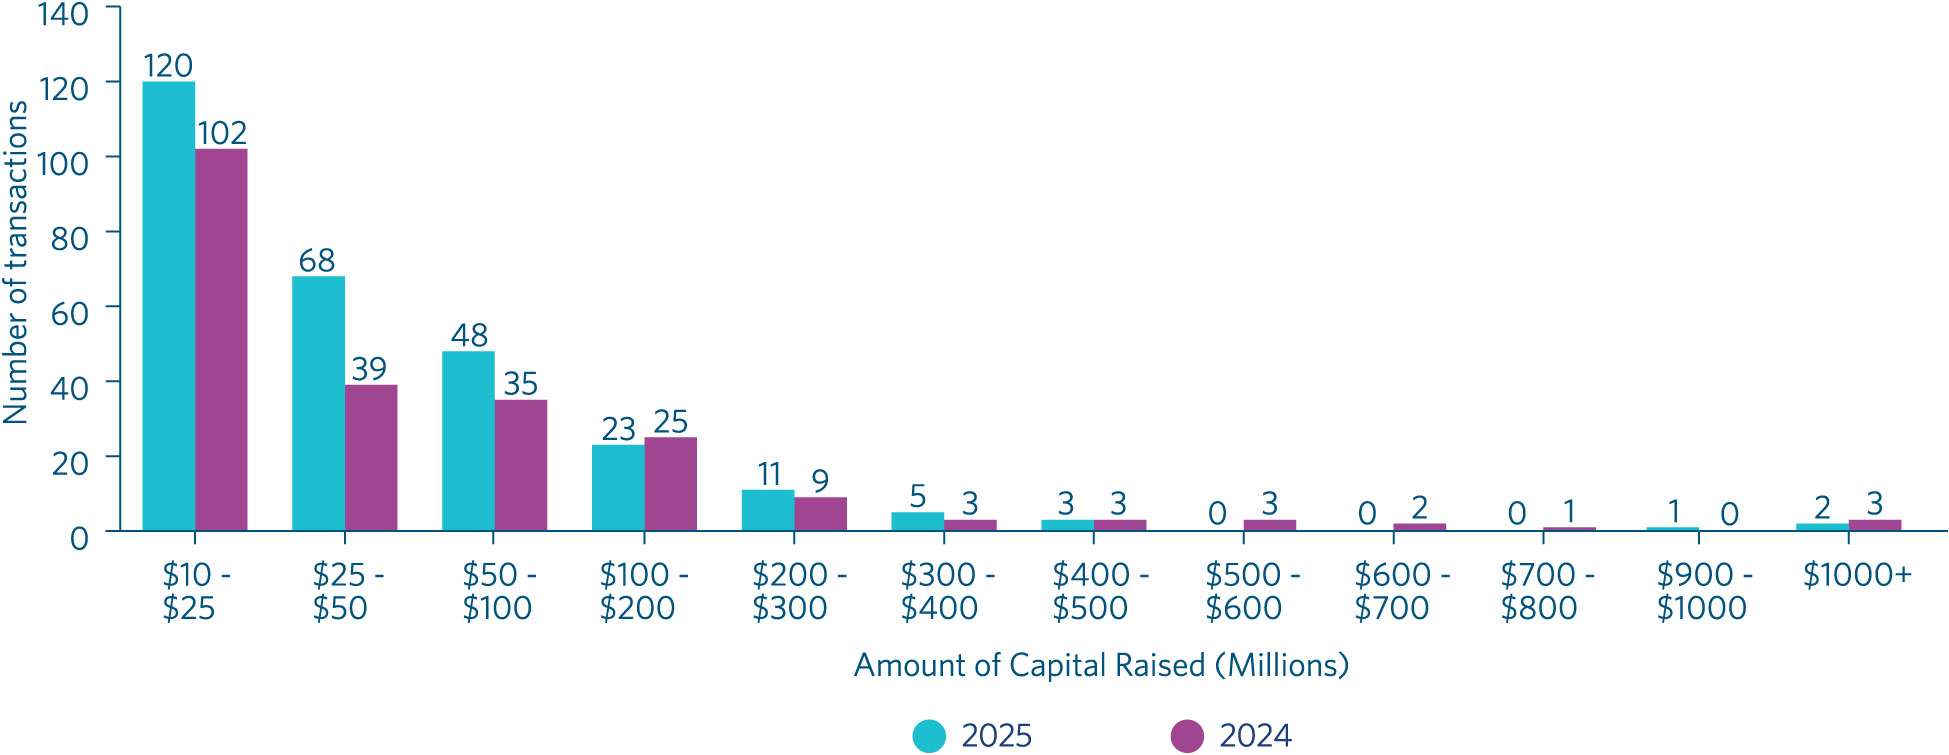
The distribution of offer sizes in 2025 broadly mirrored that observed in 2024, with an increased number of transactions recorded across most size categories. Consistent with recent years, the greatest concentration of activity occurred in the $10 million to $50 million range, which continued to account for the largest proportion of secondary raisings.
Number of transactions by offer size
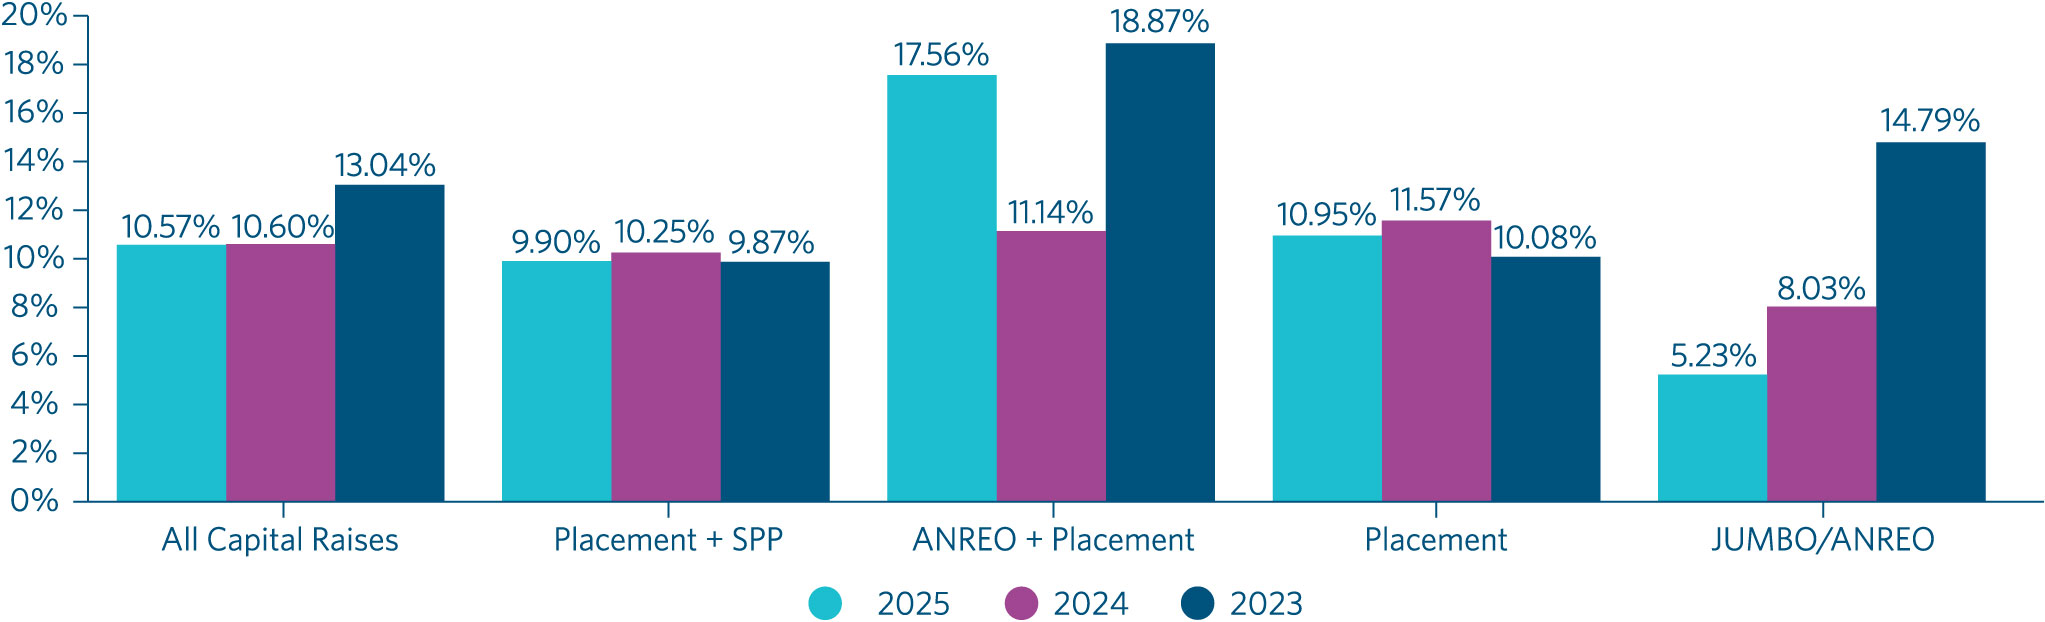
Discount levels in 2025 remained in line with the bullish market seen in 2024. The average discount to the last closing price remained steady from 10.60% in 2024 to 10.57% in 2025 for transactions over the $50 million Threshold. When considering all deals, the average discount was lower at 11.63% in 2025 compared to 14.66% in 2024. This is possibly attributable to the large proportion of transactions undertaken by way of placement.
Among specific offer types, ANREO and placement deals saw the highest average discount overall, at 16.49%. Placement and SPP transactions recorded the highest variation, with transactions below the $50 million Threshold exhibiting an average discount of 14.13%, whereas transactions above the $50 million Threshold had a much lower average discount of 9.9%.
Average discount to last close (over $50 million)
.jpg)
Average discount to last close (between $10 million and $50 million)1
.jpg)
As can be seen above, 2025 was a better year for the small end of the market, with lower discounts seen across all offer structures when compared to 2024.
Comparison ($10 million to $50 million vs $50 million plus)
.jpg)
Trends between discount rates and the size of transactions also continued from 2024, with larger companies typically able to command tighter discounts from investors.
Transactions in the $10 million – $50 million range exhibited higher average discounts across most offer types, with an overall average discount of 12.69%, compared to 10.57% for transactions exceeding $50 million in 2025. The notable exception to this was the ANREO + Placement category however this was impacted by two outliers being Syrah Resources Limited and Peninsula Energy Limited who were small issuers conducting large deeply discounted raisings after an extended period of suspension. When removing these companies from our calculation, we see the average discount reduce from 17.56% to 7.94%. For rights issues the discounts to the theoretical ex-rights trading price (TERP), slightly increased from 9.85% in 2024 to 11.48% in 2025, however this was also impacted by the two offers mentioned above. When removing those two companies from the analysis, the average discount to TERP was 8.38%.
Offer price (discount to TERP)

Offer price (discount to last closing price)
.svg)
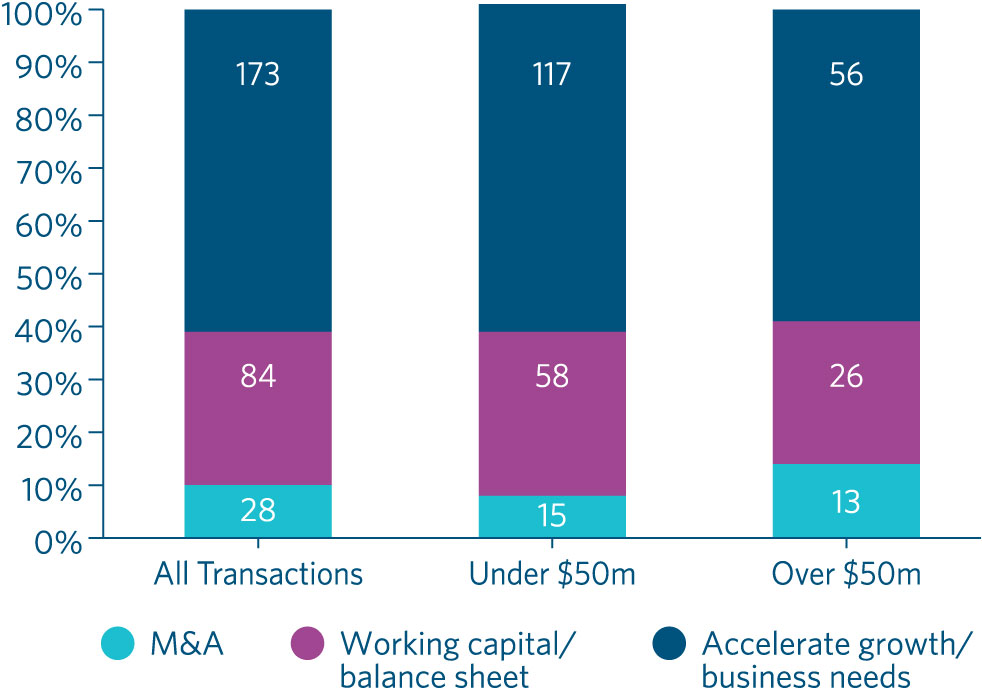
Despite there being a larger number of transactions in 2025, the proportion of transactions undertaken for M&A purposes decreased from 23.8% in 2024 to 9.8% in 2025.2
Interestingly, the number of transactions (including those below the $50 million Threshold) undertaken to accelerate growth increased significantly from 35.56% in 2024 to 60.7% in 2025.
Purposes of capital raising by transaction size
When comparing offer pricing by purpose (including transactions below the $50 million Threshold), discounts to last closing price for capital raisings undertaken to fund acquisitions (average of 10.49%) were broadly comparable to those undertaken for non‑acquisition purposes (average of 11.98%). This represents a narrower divergence than observed in 2024, when issuers seeking to fund acquisitions obtained a materially lower discount (10.01%) compared with raisings for non‑acquisition purposes (15.50%). It appears that the market was more comfortable in 2025 supporting companies raising cash for a broader range of purposes.
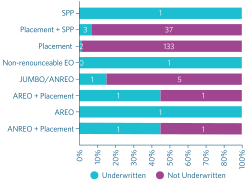
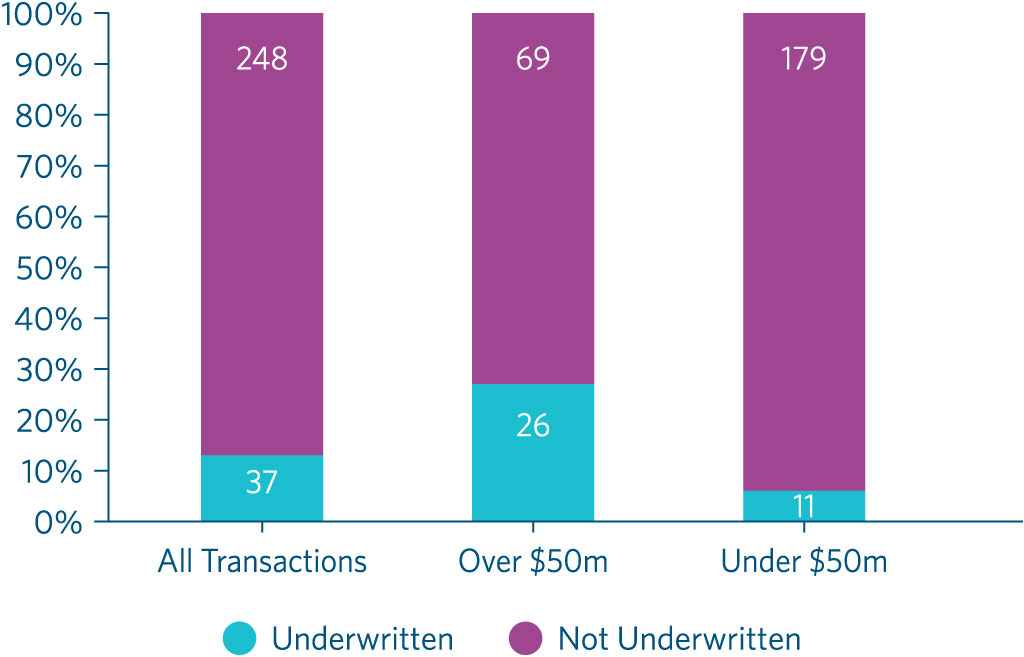
In 2025, there was a marked decline in the proportion of fully underwritten transactions compared to 2024. The data suggests issuers are increasingly favouring partially underwritten or non‑underwritten structures, likely as a means of reducing transaction costs.
This trend was particularly evident in larger transactions. In 2023, approximately 80% of offers above the $50 million Threshold were underwritten, declining to 58% in 2024 and further to 27.3% in 2025. One contributing factor was the increased prevalence of placements in 2025 relative to prior years, as placements are typically underwritten less frequently than entitlement offers due to greater pricing and funding certainty.
Under $50 million
Over $50 million
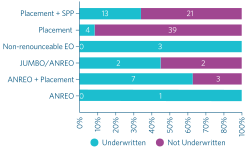
As expected, the reduced incidence of underwriting was even more pronounced at the lower end of the market, with only 5.7% of transactions below the $50 million Threshold being underwritten.
Underwritten vs. Non-Underwritten transactions
Consistent with our data set for 2024, we did not notice any particular correlation between raise size and number of lead managers/underwriters on the transaction.
Number of Lead managers- underwritten per transaction relative to offer size

Also consistent with our findings in 2024, for combined placements and SPPs, generally only the placement was underwritten, consistent with our observation of usual market practice. This is likely because issuers are typically not particularly reliant on funds raised via SPPs (which are capped at $30,000 per shareholder under relevant law and are usually used as a fairness measure for retail shareholders), and due to the enhanced underwriting risk associated with an SPP given the length of time it remains open and the nature of participating investors.
In terms of fees, average underwriting and management fees as a percentage of offer size remained broadly stable at 3.30% in 2024 and 3.87% in 2025 for transactions over the $50 million Threshold, with slight variations depending on deal size and complexity. In line with expectations and experience, the average underwriting and management fees for transactions below the $50 million Threshold were higher at 5.35%.
Underwriting/Lead manager fees plotted against transaction size

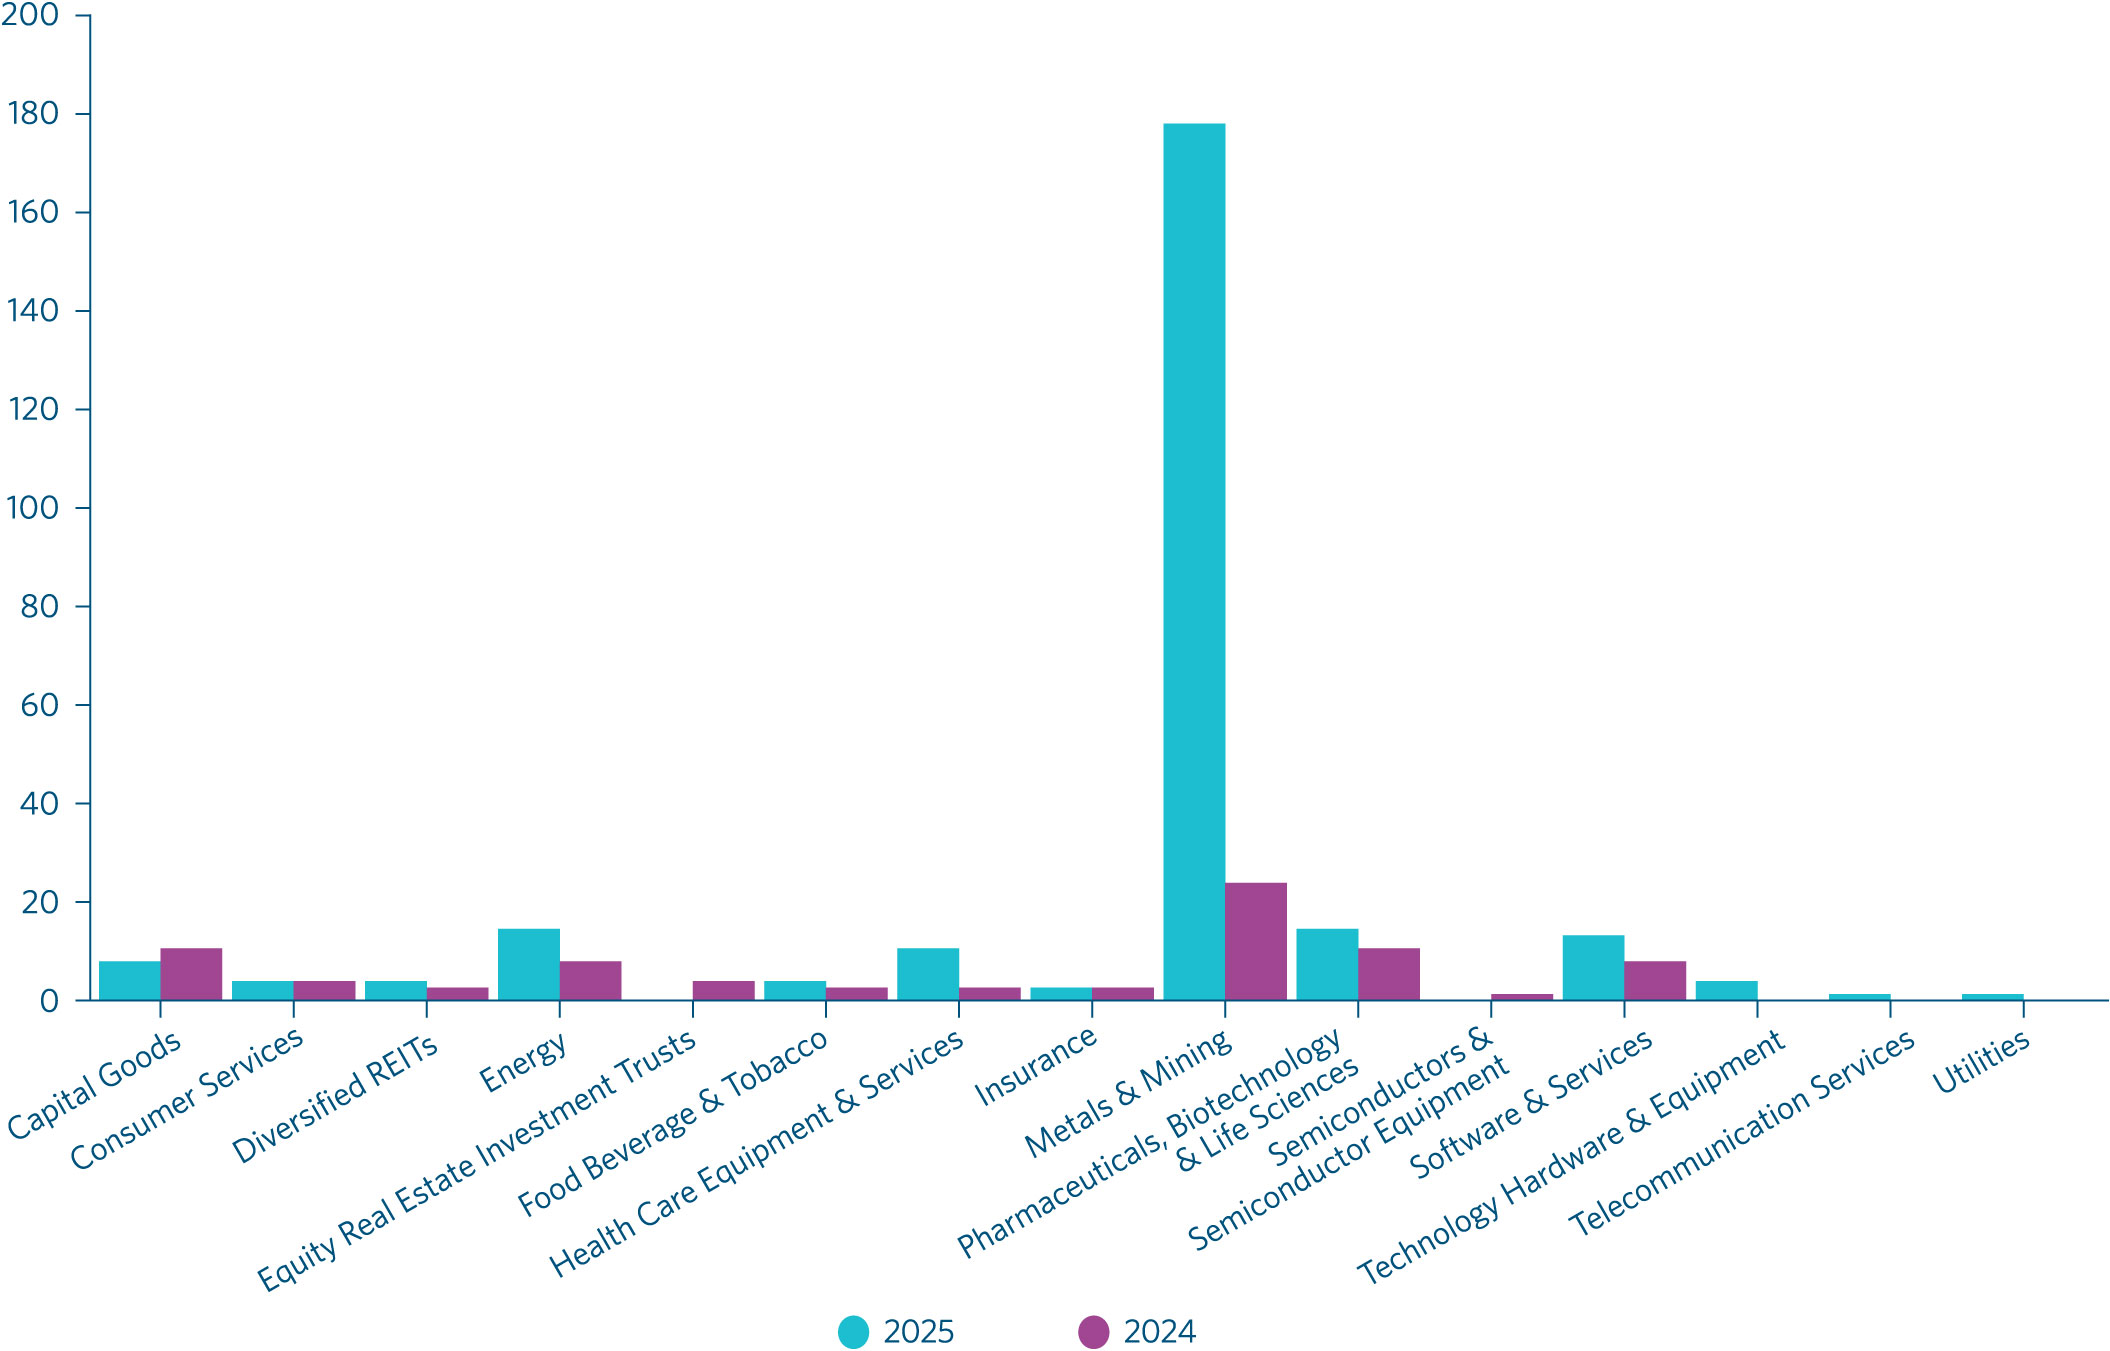
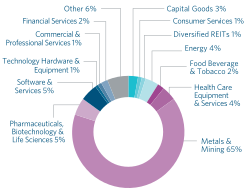
The Metals & Mining sector further grew its dominance in 2025, both by number of transactions (179, up from 100 in 2024) and total capital raised ($9.3 billion, up from $4.93 billion in 2024). Metals and mining transactions also dominated the higher end of the market, accounting for 58% of all deals exceeding the $50 million Threshold.
The Software & Services segment experienced notable growth, securing $2.28 billion across six deals, driven by demand for digital transformation and enterprise software. These figures were skewed by two large raisings undertaken by NextDC, which together accounted for 90% of total capital raised in the sector.
The Health Care Equipment & Services sector recorded a decline in total capital raised, falling to $394 million in 2025 from $1.1 billion in 2024. This was largely attributable to significant outlier transactions in 2024 by Ansell Ltd and Sigma Healthcare.
Following a strong uplift in 2024, the Pharmaceuticals & Life Sciences sector experienced more modest activity in 2025, with three transactions exceeding the $50 million Threshold raising $609 million. Across all raises, the sector raised $872 million in 2025. Despite the dip, interest in healthcare innovation and life sciences remains strong.
The largest swing was observed in the Diversified REIT sector, which grew from $440 million raised in 2024 to $4.2 billion in 2025, largely due to Goodman Group’s $4 billion fully underwritten placement and SPP to fund data centre growth opportunities. Given the rise of AI, further activity in this area is anticipated.
The Energy sector remained resilient, raising $1.1 billion across 11 deals in 2025, reflecting continued investment in renewable and traditional energy projects.
Sector comparisons (2024 and 2025)
.jpg)
Transactions over $50 million (2025)

Transactions between $10 million and $50 million (2025)
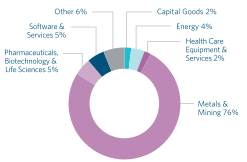
All transactions (2025)
Like last year, we examined share price performance 30 days post‑allotment.3 Post‑raise performance varied significantly across industries, with certain sectors outperforming while others faced downward pressure. Sectors such as insurance, metals and mining, and capital goods may have been supported by continued investor confidence and favourable market conditions; however, in contrast, sectors such as software and services struggled post‑raise, which may reflect sector‑specific headwinds, including the rise of AI.
Interestingly, although pharmaceuticals and biotechnology stocks showed strong performance last year, there was a noticeable decline in post‑raise share price performance in 2025. However, similar to 2024, the energy sector exhibited strong growth, likely driven by favourable commodity prices and ongoing global demand.
Post-raise share price performance by Industry

ConclusionOverall, 2025 was a strong year which saw greater activity in the secondary market, a continuation of tight discount levels and larger offer sizes. Companies have continued to tap capital markets to fuel expansion, restructure debt, and pursue strategic growth. |
The contents of this publication are for reference purposes only and may not be current as at the date of accessing this publication. They do not constitute legal advice and should not be relied upon as such. Specific legal advice about your specific circumstances should always be sought separately before taking any action based on this publication.
© Herbert Smith Freehills Kramer 2026
Receive timely insights and briefings from HSF Kramer, tailored to keep you informed and ahead